Processing satellite-derived thermal data
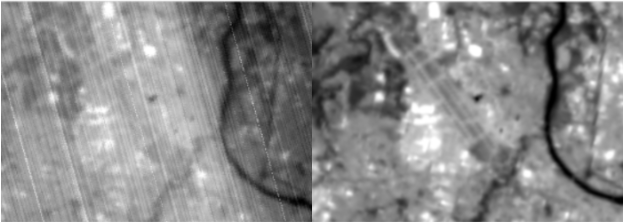
When you snap a photo with a standard phone camera, you can instantly view a clear image. However, this is not the case with a scientifically graded thermal imager, such as HiVE’s. For example, take a look at the raw imagery near Toulouse airport from our HiVE thermal imager (simulated). The airport and the nearby river features are hardly distinguishable until post-processing is applied. Therefore, constellr combines the use of VNIR and TIR data to generate high-quality LST imagery.
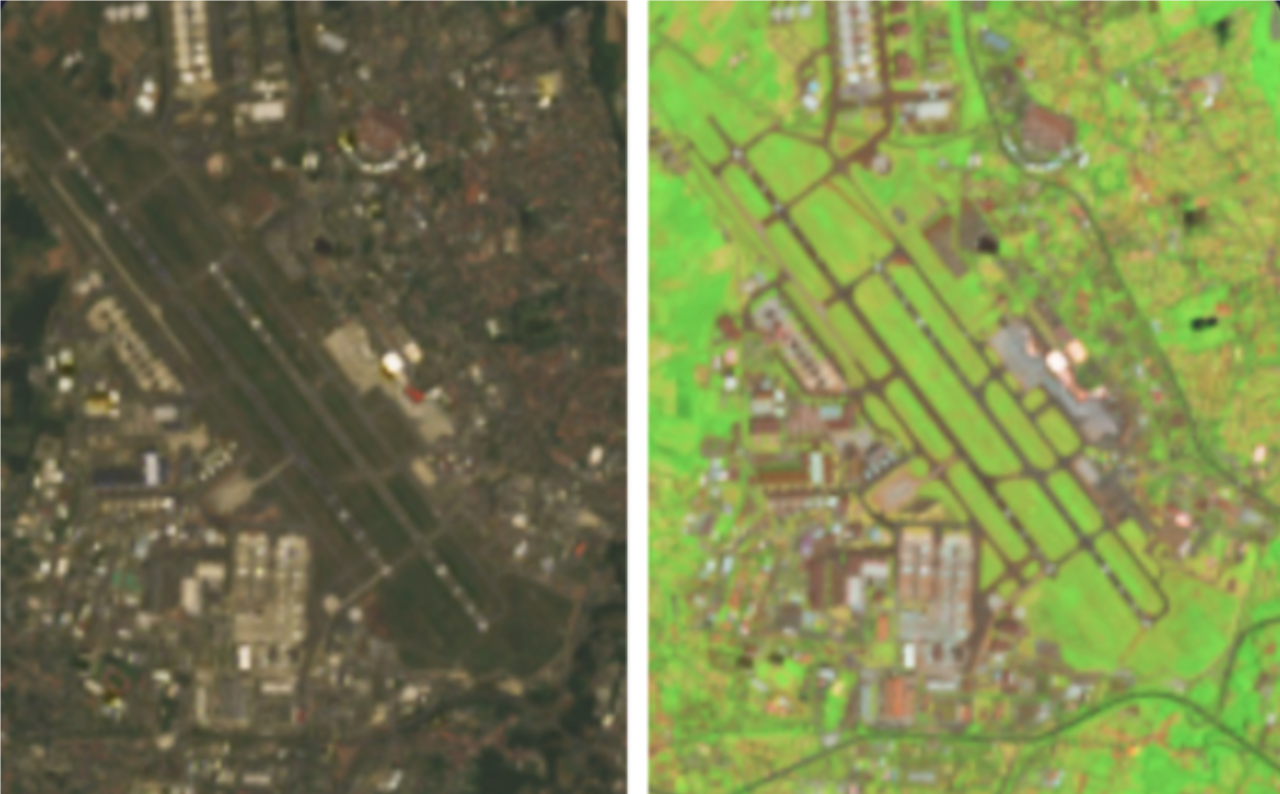
The VNIR sensor on constellr’s satellites is similar to the Sentinel-2 mission, capturing data in the visible and near-infrared spectrum. VNIR data provides crucial contextual information, helping to interpret thermal data accurately by identifying specific features on the ground, such as rivers, vegetation, and urban areas. This is essential for ensuring that temperature measurements are precisely linked to specific locations on Earth.
On the other hand, Thermal Infrared (TIR) sensors capture the heat emitted by objects on the Earth's surface. This data is critical for detecting temperature variations and identifying hotspots. Constellr captures long-wave thermal data emitted by objects on the Earth’s surface. As displayed above, raw thermal images can be challenging to interpret without the contextual information provided by VNIR data. Therefore, VNIR data plays a pivotal role in enhancing the usability of thermal images. Without VNIR support, interpreting thermal data can be challenging, as features that appear similar in temperature might look very different in VNIR imagery. This contrast helps analysts pinpoint the exact location and nature of heat anomalies, providing a more accurate understanding of, for example, urban heat patterns.
For example, comparing a standard RGB image with a VNIR-enhanced image near Toulouse airport shows how VNIR data can highlight differences in vegetation, water bodies, and built-up areas. This differentiation is crucial for accurate thermal analysis, ensuring that hotspots are correctly located and identified.
Your gateway to decoding Earth's temperature.
From pixels to planetary resilience.
Explore constellr's data, learn about thermal intelligence, explore our use cases and download actionable demo data sets.