LSTzoom
What is LSTzoom?
LSTzoom is optimized for localized analysis where fine spatial detail is critical, such as thermal footprints for defence and intelligence and for infrastructure and industrial hotspots. It is based on our LSTprecision product with an additional sharpening algorithm applied to it to increase the spatial resolution up to 10m.
When should you use LSTzoom?
- See more, see clearly: Visually detect even the smallest local variations with high-resolution temperature detail.
- Effortless understanding: Granular thermal contrasts make interpretation straightforward, turning complex data into clear asset-level insights.
- Intelligence at scale: Refined contrast brings hidden patterns to light, unlocking smarter monitoring and decision-making.
- Stay ahead of risks: Identify early warning signs of stress across infrastructure, materials, and the environment before problems escalate.
- Track change over time: Frequent revisit cycles (as fast as every 3 days in daylight) build a powerful time-series for spotting anomalies and long-term trends with confidence.
Looking for consistent daily insights across large areas? → Discover LSTfusion
Prefer highly accurate temperature benchmarks over time? → Explore LSTprecision
How is LSTzoom created?
LSTzoom is a supervised deep learning super-resolution framework designed to reconstruct land surface temperature (LST) at 10 m resolution from 30 m thermal imagery.
It relies on a robust, physics-informed methodology:
-
A dedicated airborne dataset provides high-resolution LST reference data. To replicate realistic satellite observations, these data are degraded using a physically grounded forward model that integrates a custom, sensor-specific point spread function (PSF) along with spatial downsampling.
-
A convolutional neural network is then trained to learn the inverse of this degradation process. The model architecture combines residual learning with reflection padding to reduce edge artifacts and preserve spatial coherence.
-
Performance is assessed on independent airborne scenes using both pixel-level accuracy metrics and structural similarity indicators, ensuring reliable and consistent reconstruction quality.
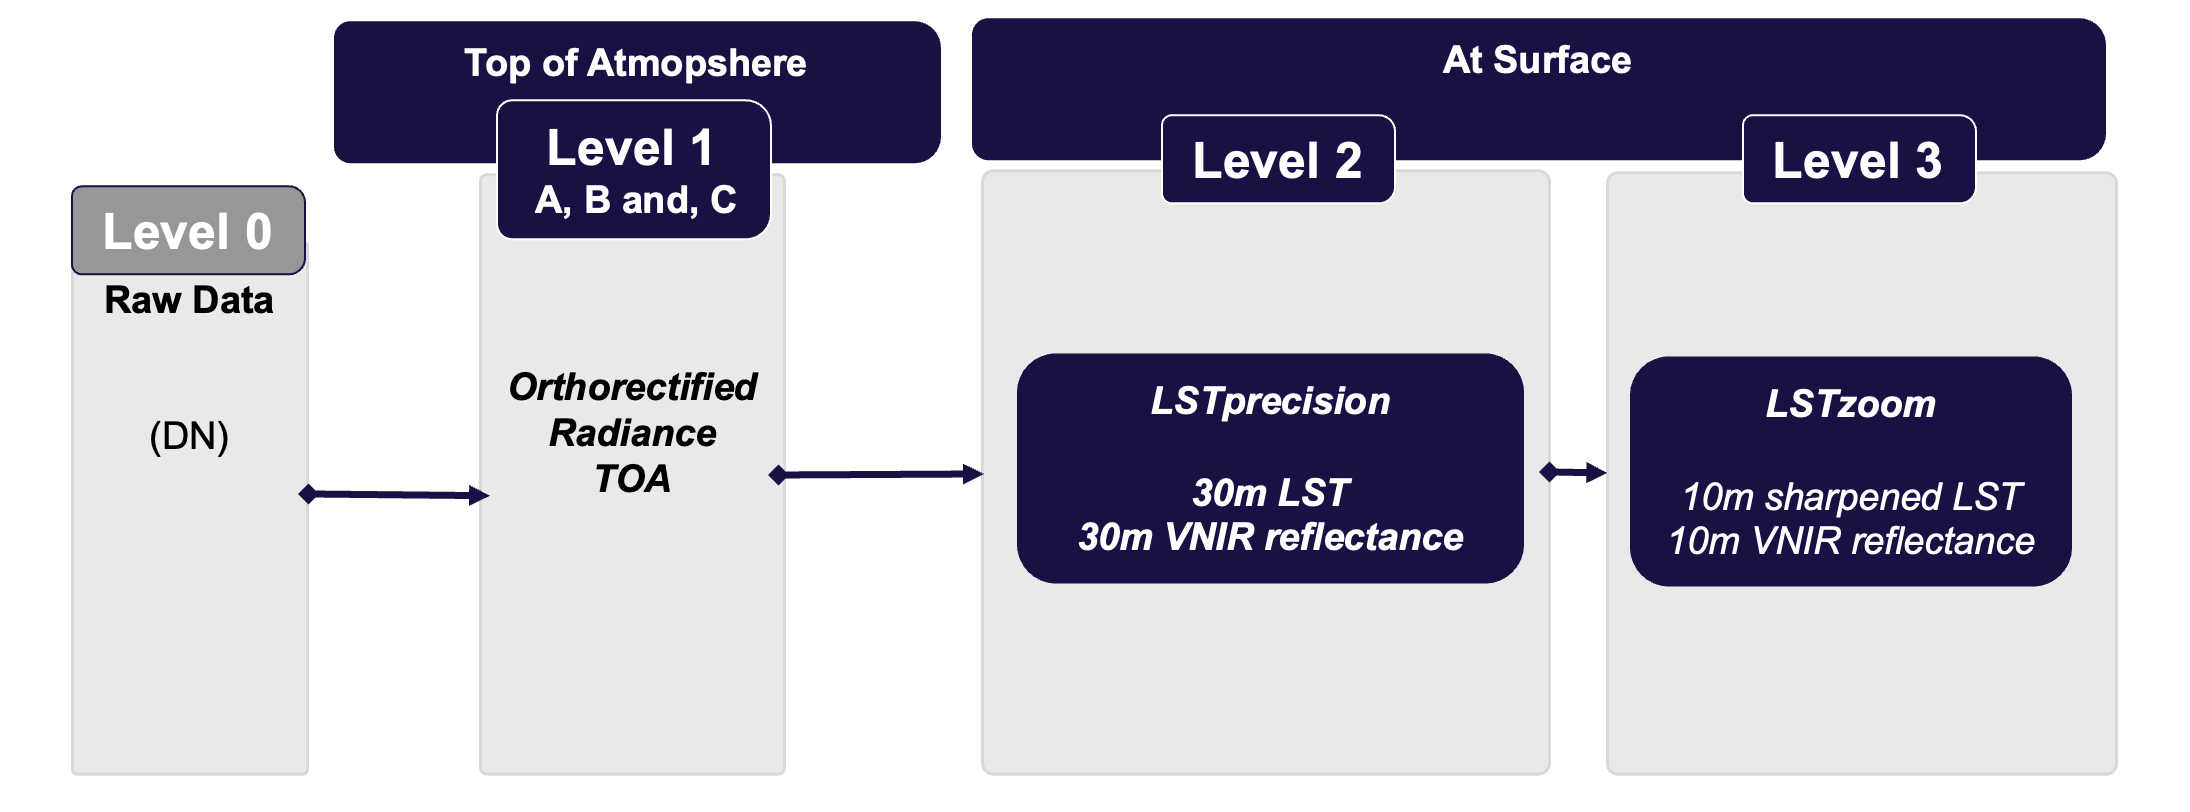
LSTzoom is thus a Level 3 (L3) product that refers to products resulting from the further processing of L2 data or model output based on L2 data and other external datasets, as shown in the figure below.
What are the specifications of LSTzoom?
| Parameter | Value |
|---|---|
| Spatial Resolution | 10m |
| Temporal Resolution | 1.5 - 3 days |
| Output Time | 10:30 or 13:30 am and pm, local solar time |
| Coverage Area | Worldwide tasking, up to 1.000.000 km² daily imaging capacity |
| Output Format | GeoTIFF + Metadata geojson |
For more see the Technical Specifications page.
How accurate is LSTzoom?
The methodology used to generate the LSTzoom product was evaluated against high-resolution airborne land surface temperature measurements from the HYTES instrument. The LSTzoom algorithm was applied to a downscaled version of these reference data, and the resulting outputs were compared with the original observations. In challenging urban environments, the estimated accuracy of the method is better than 3 K.
What to look forward to in future developments?
- Improve even further the output resolution up to 5m.
- Use of embedding and foundation models to further imporve detailed reconstruction.
Last update: March, 2026
Your gateway to decoding Earth's temperature.
From pixels to planetary resilience.
Explore constellr's data, learn about thermal intelligence, explore our use cases and download actionable demo data sets.